BLOYL Customer loyalty Platform
Enterprise customer loyalty platform for engagement, promotions, and rewards


Boost customer engagement and fuel revenue growth with strategic loyalty and promotions programs.

Uncover the trends, behaviors, and performance metrics that power smarter customer engagement and deliver real business results. With Brandmovers’ analytics capabilities, you can go beyond surface-level reporting to unlock actionable insights across every touchpoint.
Your loyalty program generates powerful customer data, our analytics platform helps you use it. Brandmovers gives you more than just dashboards, we deliver actionable insights. From tracking member journeys to measuring offer effectiveness, we help you connect the dots between data and outcomes.

With advanced analytics built into your loyalty platform, you can:
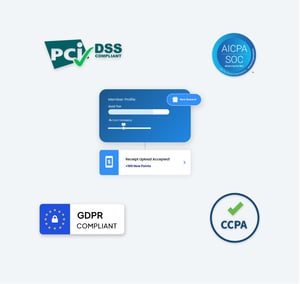
Data is only valuable if it’s protected. Brandmovers uses industry-leading protocols to ensure your loyalty program data is accurate, compliant, and secure.